Economics Brief: The Rise in Income Inequality in the United States

A thousand people in San Francisco spelled out a message on a beach in 2011. The U.S. is unusual not only for having such extreme inequality of incomes, but also for doing less than other countries to redistribute those incomes more equitably through taxes and transfers. Photo: Darya Mead
Part 1: The Name of the Game Is Class Struggle
It’s no secret that, over the last 40 years, income inequality has soared in the United States.
In the late 1970s, the top 10 percent of the U.S. population, ranked by income, received about one-third of total U.S. income. They now receive about half of total income.
Over the same period, the income share going to the top 1 percent has increased from about 10 percent of total income to about 20 percent today. The share going to the top one-tenth of one percent has increased from almost 3 percent to over 10 percent.
This top one-thousandth of the income ranking now gets about the same total income as the entire bottom 40 percent of the U.S. population.
The compensation of nonsupervisory workers, who make up over 80 percent of the U.S. labor force, has stagnated since the 1970s. Most of the growth in incomes has been captured, instead, by business owners, executives, and others at the top of the income ranking.
This shift in the income distribution is largely a product of changes in the balance of power—at the workplace level and at the political level—between different economic classes in U.S. society.
WEAKER UNIONS = MORE INEQUALITY
Over the last 40 years, owners and managers of large corporations have waged a relentless and highly successful campaign against the collective power of workers.
Employers’ efforts to break unions where they did exist and to oppose unionization where they did not, more often than not with the connivance of government officials, has borne bitter fruit: union membership in the private sector has plummeted below 1 out of every 15 workers.
While especially pronounced in the United States, similar attacks have afflicted workers in many high-income or “advanced” economies. Weaker labor movements have meant higher degrees of income inequality.
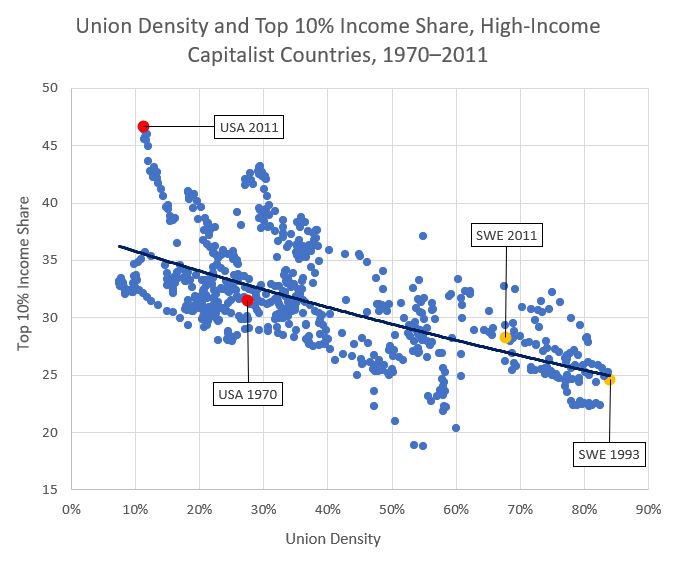
The black line is fit, using standard statistical methods, through the middle of the cloud of points. It indicates the top 10 percent income share we would predict if we knew nothing but the union density in a particular country for a particular year. Its downward slope indicates that higher union density is associated with a lower income share for the top 10 percent; a lower union density, with a higher income share for the top 10 percent.
As union density has declined in most high-income countries, income inequality has increased. In Sweden (two yellow points), for example, it has increased by about three percentage points from 1993 (the year of the country’s union-density peak) to 2011. Its top 10 percent income share for both years is close to the predicted level for that union density.
In the United States (two red points), union density has also declined over this time period (its highest union density came in 1970, the first year in the data series; its lowest came in 2011, the last year in the series). Over that time, the top 10 percent income share has increased dramatically, from a little below the predicted level to far above it.
That is, the concentration of income at the top has increased far more than we would predict just from the decline in union density.
Source: Figure design by author; data courtesy of Florence Jaumotte and Carolina Osorio Buitron. Countries included: Australia, Canada, Denmark, Finland, France, Germany, Ireland, Italy, Japan, Netherlands, New Zealand, Norway, Portugal, Spain, Sweden, Switzerland, United Kingdom, United States. Years included: 1970-2011, with some exceptions due to unavailable data.
Comparing 20 different high-income countries over the period between 1980 and 2010, economists Florence Jaumotte and Carolina Ororio Buitron found that differences in unionization rates—across different countries and different years—accounted for more than 40 percent of the variation in the income shares of the top 10 percent.
When the unionization rate is higher, the income share of the top 10 percent is lower; when the unionization rate is lower, the income share of the top 10 percent is higher.
It is unlikely that the picture would change much if we looked instead at the top 1 percent or the top 0.1 percent, as the growth of their income shares are main drivers of the growth in the income share of the top 10 percent.
HOW DO UNIONS REDUCE INEQUALITY?
There are at least three major ways, described in previous research by economists and other social scientists, in which unions tend to narrow income inequalities:
First, unions boost the incomes of workers in low-wage occupations relative to workers in other occupations. Workers in lower-wage occupations are more likely to become union members—and to get increased wages and employer-provided benefits—than workers in already higher-income occupations.
Second, unions tend to boost the incomes of their lowest-wage members to a greater degree than the incomes of higher-wage members. This reduces the income gaps (produces “wage compression”) among unionized workers.
Third, unions tend to pull down the incomes of those at the top. While employers try to pass on cost increases (such as those resulting from higher wages and benefits) to customers in the form of higher prices, they cannot normally do so fully. As a result, increases in worker compensation tend to “squeeze” profits, reducing the income inequalities between workers and employers.
But bargaining between workers and employers isn’t the whole story. In almost all high-income countries, taxes and transfers reduce the degree of income inequality to some degree—though in some countries much more than others.

Part 2: Time to Get Political
The income distribution in capitalist economies is determined to a great extent by “market incomes”—that is, incomes derived from the sale of something or other in a market.
For business owners, market incomes are based on the amount and prices of the goods and services that they sell, minus the amount and prices of the inputs that they buy. For workers, market incomes are largely based on the amount and price of what they sell—their labor power.
In the United States and other high-income countries, incomes “after taxes and transfers” are generally distributed at least somewhat more equally than market incomes.
“Progressive” taxes are those that take income disproportionately from those at the top—for instance, income taxes with higher rates for higher income brackets, taxes on forms of income that go largely to high-income individuals (such as capital gains taxes), taxes on corporate profits, and taxes on wealth (such as estate taxes).
Meanwhile, “transfers”—government programs benefiting low- and middle-income individuals—redistribute some income to those closer to the bottom.
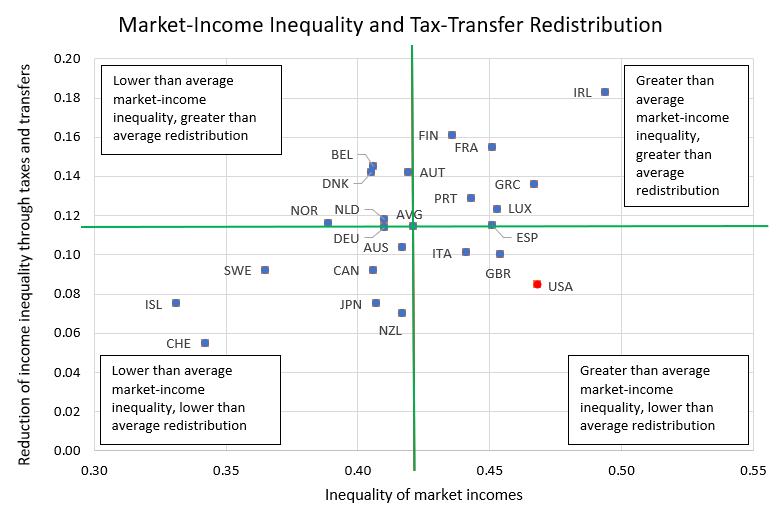
Sources: Figure design by author, based on a similar figure in Isabelle Joumard, Mauro Pisu, and Debbie Bloch, “Tackling Income Inequality: The Role of Taxes and Transfers,” Organisation for Economic Co-operation and Development, OECD Journal: Economic Studies, Vol. 2012/1 (oecd.org). Inequality of market incomes measured as Gini coefficient (0 = perfect equality, 1= maximum inequality) for market incomes (before taxes and transfers), working-age population (18-65). Reduction of income inequality measured as Gini coefficient for market incomes, working-age population, minus Gini coefficient for disposable incomes (after taxes and transfers), working-age population (18-65). Data from OECD Income Distribution Database (IDD), Organisation for Economic Co-operation and Development (stats.oecd.org).
Economists Isabelle Joumard, Mauro Pisu, and Debbie Bloch have found that countries with more unequal market incomes, by and large, do more to redistribute incomes via taxes and transfers.
The U.S., however, is an exception, with higher-than-average inequality of market incomes and lower-than-average redistribution through taxes and transfers (see figure). Why?
NO LABOR PARTY
In most high-income countries, labor-based political parties (usually referring to themselves as “labor,” “social democratic,” or “socialist” parties) have played a leading role historically in bringing about policies that reduce income inequality.
While there is no agreed-upon way to define a labor-based party, some of the major factors are their historical origins in the workers’ movement, formal connections to labor unions and union federations, limitation of membership to ordinary workers (excluding employers and managers), and rejection of financing from business owners.
Such parties influence the distribution of income through various policies, including protections for unionization, regulations on labor market outcomes like wages and hours, whole-economy policies emphasizing full employment (government spending to boost demand and private employment, direct public employment programs, etc.), and taxes and transfers that redistribute income downwards.
The high-income capitalist countries where labor-based parties have historically been strongest—such as the Nordic countries—are among those with the lowest income inequality. The U.S., on the other hand, sticks out among high-income capitalist countries by the absence of a major labor-based political party.
This is certainly among the main factors explaining the relative weakness of labor organization, labor-market regulation, and the welfare state in the United States, compared to other high-income countries. In almost all other such countries, there is at least one significant labor-based political party; in many, there are several with differing political programs.
BUT THAT’S NOT ALL
The influence of reform-minded labor-based parties, however, is by no means a guarantee of declining inequality, and no country should be romanticized as some sort of workers’ paradise.
During the post-World War II period, income inequality was on the decline in most high-income capitalist countries. Now, that trend has stopped in almost all of them. In many, whether there is a major labor-based political party or not, inequality has been on the rise again.
Not all problems of capitalist economies can necessarily be solved by reforms that leave the basic structure of the economic system intact. This does not mean they cannot be solved at all.
It does mean, however, that lasting solutions would require more fundamental systemic change.
Alejandro Reuss is an instructor in Labor Studies at UMass Boston and former co-editor of Dollars & Sense. He is also the author of “The Power of Capital: An Introduction to Class, Domination, and Conflict” (Economics in Context Initiative, Global Development Policy Center, Boston University). Available for free on the Economics in Context Initiative website (bu.edu/eci), it explores issues of class power and inequality like those discussed in this article.